

Particle size analysis has allowed lab technicians and lab managers to provide insight into the quality of the material throughout their manufacturing productions line. Many have begun to turn to innovative particle analysis equipment, such as dynamic image analysis systems, to keep up with the latest trends and improve operations.
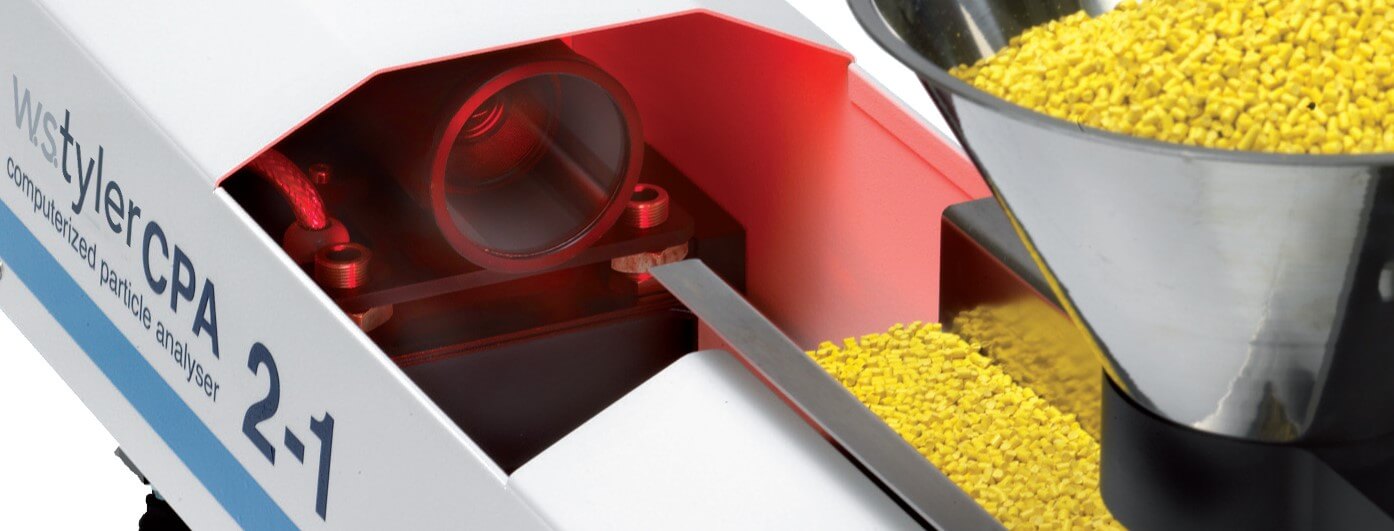
Devices, such as the W.S. Tyler Computerized Particle Analyzer, allow particle analysis labs to test material in a matter of minutes. This offers lab technicians and managers a sigh of relief, as it enables you to reallocate time towards fixing any issues within your production line based on the results you obtain.
Now, having said that, obtaining and analyzing the results you yield during a dynamic image analysis can seem daunting at first glance. Let us assure you it's easier than it looks.
W.S. Tyler has spent over 25 years mastering the dynamic image analysis process and leveraging this experience to help dozens of labs across countless industries, including yours, see the value of dynamic image analysis.
We strive to help you reach your particle analysis goal by helping you understand the dynamic image analysis process from beginning to end. This includes helping you analyze your results.
For that reason, this article will provides insight into the following:
- How to analyze your particle analysis results after a dynamic image analysis
- How to store your results to reference later
- How you can cross-reference your results with a standard test sieve analysis
How Are CPA Results Analyzed?
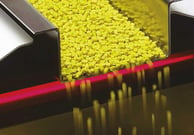
After conducting a reliable dynamic image analysis with a W.S. Tyler Computerized Particle Analyzer, there are two ways in which you can review your results in real-time: video presentation or result presentation. The video presentation option provides a visual of the individual particles within your sample falling past the camera, whereas the results presentation option provides exact fractional information that reflects the virtual sieves used.
When viewing these results, you can expect to obtain the mass of particles on each sieve in comparison to the mass of the entire sample, the amount of particles each sieve retained, and the amount of particles that passed through each sieve.
When it comes to the physical properties of the particles, dynamic image analysis results will inform you of both the longest and shortest distance between two parallel tangents (maximum ferret and minimum ferret), the vertical distance of the particle (ferret diameter), the diameter of a sphere that has an equal surface area (equivalent diameter), and the measurement of the bisected horizontal line (martin diameter). Additionally, you'll be able to identify the sphericity, circularity, and roundness of each particle the falls past the camera.
How Are Results Stored?
When working the CPA, there are two file types that you need to check for: Han files and Gan files.
Han files are the file that the CPA automatically generates. Any test that is done on the CPA is saved as a .han file.
That said, when saving the .han files, it is best if you label them with material name and number of tests. For example: Salt granules 06.han.
Gan files are created after data from an external test sieve correlation that cross-references the CPA results to the initial lab results is imported. Every time you enter sieve data into the software, a .gan file will be created.

How To Enter Sieve Data
To enter sieve data, you must first go to the "results list" tab in the software. You will need to navigate to the left window, right-click, and click "add folder."
Once this is done, you should use the folder you use to store the .han files created by the CPA. This is a critical step as .han and .gan files must be stored in the same folder.
The next step is to navigate to this folder within the CPA software. You should move the mouse over the icons until you locate "new Gan File." Create a new Gan file using the same naming conventions as you would with a .han file.
After the new .gan file is created, select it and view the various options within the right window. Choose the "sieving results - Points of Distribution" option.
At this point, direct your attention to the three-dot icon on the right side. A new window will appear after selecting this, and you should click the "import sieve set" option as well as the set for the material being tested.
Finally, you can choose the value on the right side and enter any sieve results you have. This will complete the .gan file, and you can use it moving forward.
Take Your Results a Step Further With Alignment Files
Dynamic image analysis systems are devices that help facile a more efficient particle size analysis, proving visual and graphical results in real-time. These results provide insight into where the particles stand within the virtual sieve stack as well as several physical properties of the particles, such as the sphericity, circularity, and roundness.
Now, one of the critical features of a dynamic image analysis system is that it can generate two types of files. One file represents the results from the dynamic image analysis, and the other representing how the test compared to a standard test sieve analysis.
But when browsing the various device on the market, you may find yourself hesitant as it's not always clear as to how different the results a new device will produce in comparison to your existing process. Well, you're not alone, as this level of doubt is common in an industry where precision and consistency are everything.
W.S. Tyler understands the need to trust the equipment in your lab. To help provide relief, we work to void any gaps when customers update their particle analysis equipment.
To that end, the following article was written to help you better understand how the CPA can work in tangent with your existing test sieve analysis setup: